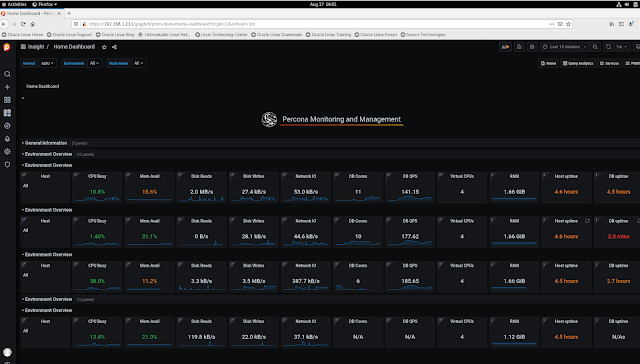
Percona Monitoring and Management (PXC Part 5)
Percona Monitoring and Management (PMM) is Percona’s open-source tool for monitoring and alerting on database performance and the components that contribute to it.
PMM is a free tool that monitors MySQL (Percona Server and MySQL Community Edition), PostgreSQL, Amazon RDS/Aurora, MongoDB (Percona Server and MongoDB Community Edition), Percona XtraDB/Galera Cluster, ProxySQL, and Linux.
Part 1 of the article - Percona XtraDB Cluster (PXC) 8.0 Installation/Configuration
Part 2 of the article - ProxySQL 2 configuration/installation
Part 3 of the article - Installation & Usage of Percona Toolkit
Part 4 of the article - Percona Xtrabackup Backup & Recovery
Key Benefits of Percona Monitoring & Management
- Reduced complexity and simplified management.
- Metrics Monitoring.
- Optimized database performance.
- Improved data security.
PMM (Percona Monitoring and Management) is made up of a server and clients.
PMM client is installed on the database servers and is used to collect metrics. The client contains technology specific exporters (which collect and export data), and an admin interface, which makes the management of the PMM platform very simple.
PMM server is a pre-integrated unit (Docker, VM or AWS AMI) that contains four components that gather the metrics from the exporters on the PMM client(s).
PMM server runs as a Docker container or Virtual Machine.
The PMM server contains Consul, Grafana, Prometheus and a Query Analytics Engine.
<ip_address_PMM_server> - PMM login (web management console)
https://192.168.1.111/ default user name and password - admin admin
<ip_address_PMM_server>/prometheus/ - Prometheus
<ip_address_PMM_server>/orchestrator/ - Orchestrator
<ip_address_PMM_server>/graph/ - Grafana
<ip_address_PMM_server>:8500/ui/#/dc1/ - Consul
Installing PMM Server (2.20)
From the Percona website, download pmm-server-2.20.0.ova file for VirtualBox. And install it in your local VirtualBox, as a VM instance.
Configuration of PMM Server OVA file for Virtual Box:
VM specifications
Component Value
OS CentOS 7.9 (64-bit)
CPU 1
Base memory 4096 MB
Disks LVM, 2 physical volumes
Disk 1 (sda) VMDK (SCSI, 40 GB)
Disk 2 (sdb) VMDK (SCSI, 400 GB)
We need to configure our database for monitoring. For Percona XtraDB Cluster, login to one of the nodes and issue the commands below using mysql CLI.
MySQL> CREATE USER 'pmm'@'localhost' IDENTIFIED BY 'pass' WITH MAX_USER_CONNECTIONS 10;
MySQL> GRANT SELECT, PROCESS, SUPER, REPLICATION CLIENT, RELOAD ON *.* TO 'pmm'@'localhost';
Installing the PMM Client (version 2)
If you are running an RPM-based Linux distribution, use the yum package manager to install PMM Client from the official Percona software repository.
# yum list all | grep pmm
# yum install pmm2-client -y
If you are running a DEB-based Linux distribution, use the apt package manager to install PMM Client from the official Percona software repository.
$ apt-get install pmm2-client
PMM (Percona Monitoring and Management) Admin utility
# pmm-admin
# pmm-admin --version
# pmm-admin list
# pmm-admin status
# pmm-admin inventory list services
# pmm-admin inventory list services --service-type=mysql
# pmm-admin config --server 192.168.100.1
# pmm-admin config --server 192.168.2.35 --server-insecure-ssl --server-user admin --server-password admin --force
# pmm-admin config --server-insecure-tls --server-url=https://admin:admin@192.168.1.111:443
# pmm-admin add mysql
# pmm-admin add mysql --username=pmm --password=pass --query-source=perfschema
# pmm-admin add mysql --query-source=perfschema --username=root --password=root --host=192.168.66.35 --port=3317 --service-name=mysql-192.168.66.35-3317
# pmm-admin add proxysql --username=admin --password=admin
# pmm-admin add proxysql --username=pmm --password=pmm --service-name=my-new-proxysql --host=127.0.0.1 --port=6032
# pmm-admin add proxysql --username=root --password=root --host=192.168.66.35 --port=16032 --service-name=proxysql-192.168.66.35-16032
# pmm-admin add proxysql:metrics --dsn "admin:admin@tcp(localhost:6032)/"
# pmm-admin add mongodb
# pmm-admin add mongodb --host=192.168.66.35 --port=27017 --service-name=mongodb-192.168.66.35-27017
# pmm-admin add mongodb --username=root --password=root --host=192.168.66.35 --port=37017 --service-name=mongodb-192.168.66.35-37017
# pmm-admin add mongodb --cluster satya-mongo-cluster --replication-set=satya_rep --username=root --password=root --host=192.168.66.35 --port=37023 --service-name=mongodb-192.168.66.35-37023-satya_rep
# pmm-admin add postgresql --username=pmm-managed --password=pmm-managed --host=127.0.0.1 --port=5432 --service-name=PG-127.0.0.1-5432
# pmm-admin check-network
PMM helps to improve the performance of databases, simplify their management, and strengthen their security. And it’s efficient, quick to set up, and easy to use.
PMM used to simply view, monitor, and manage all open source databases in one place. And query & metric information enables you to rapidly find, solve, and prevent issues with scaling, bottlenecks, and potential outages.
Visualizing Percona MySQL/XtraDB Cluster Metrics
We can now visualize the metrics on our PMM server dashboard. Head to the Metrics server dashboard and navigate to Dashboards.
PXC Cluster Dashboard:
Related Percona Articles: ProxySQL installation and configuration Percona Xtrabackup Backup & Recovery


No comments:
Post a Comment